As discussed in our previous posts, there are two kinds of Machine Learning problems i.e. Classification and Regression. In this post, we will look into Regression and implement one of the simplest regression algorithms in Python.
Regression :
Regression models are used to predict a continuous variable using our features. In simple terms, our target value will be a numeric or a real value. For example, predicting the price of house given its location, size and other features.
There are several types of regression models in machine learning based on the hypothesis we have i.e. our features. Some of them are listed below:
- Linear
- Polynomial
- Step Wise
- Logistic
- Lasso
- Ridge etc.
In this article, we will focus on one of the most widely used regression model i.e. Linear Regression.
Linear Regression
Linear Regression is a technique in which the relationship between predictives and the predictor is modeled using a linear approach i.e. a straight line. Therefore, linear regression can be expressed as : y= mx + c .
Types of Linear Regression:
There are three types of Linear Regression :
- Simple Linear Regression.
- Multiple Linear Regression.
- Multivariate Linear Regression.
In simple linear regression, there will be only one independent variable and a single dependent variable. In multiple Linear Regression, the number of independent or explanatory variables can be more than one. This is different from multivariate Linear Regression in which, there can be multiple dependent variables i.e more than one.
You can see an error term in the equations. This is because, most of the times Linear Regression is prone to over fitting. Wait, what is overfitting ?
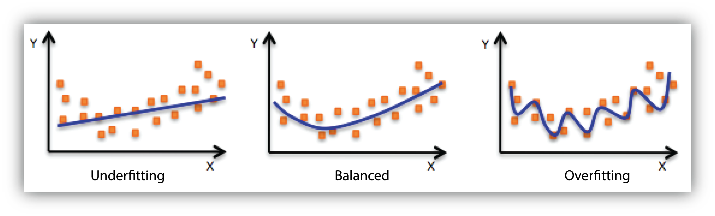
OverFitting :
OverFitting is a condition in which, our models strictly follows the training data making no room for unseen values or new data. This is often a result of more complex models and can be prevented by a technique known as cross validation.
UnderFitting :
UnderFitting is an exact opposite of over fitting in which the model performs poorly even on the training data. It means, its not able to model the training data or generalize it for new data. The most common cause of underfitting is lack of training data.
Now that we know a bit on the concepts of Linear Regression, let’s code it in python using sklearn module.
Linear Regression in Python
We are here with the implementation in Python. As we discussed in this post, we will go through each of those steps.
Data Collection and Preparation :
In this article we will deal with Boston Data which is used to predict prices of houses given certain features in the city of Boston. This dataset is preloaded in your sklearn module.
from sklearn.datasets import load_boston
data=load_boston()
Now that we have loaded data, let’s see what it exactly has in it using the following code.
print(data.DESCR)This line would output the following :

There is no need of much preprocessing, as they have mentioned that they are no missing values in this data. So, let’s create both the features and our target dataframe from our data.
import pandas as pd
boston=pd.DataFrame(data["data"],columns=data["feature_names"])
boston.head()
prices=pd.DataFrame(data["target"],columns=["price"])
prices.head()
The above code will output the following :


Now that we have our data let’s visualize them using pd.DataFrame.plot() function provided in the pandas library.
boston.plot()
prices.plot()
The above code outputs the following:


Splitting the Data
Now let’s split our data into train and test data using train_test_split in sklearn.model_selection module.
from sklearn.model_selection import train_test_split
X_train,X_test,y_train,y_test=train_test_split(boston,prices)
print("Train Data Size:",X_train.size)
print("Test Data Size:",X_test.size)
This code would output the following :

Modeling our data using Linear Regression
Let’s fit our data into a Linear Regression model using Linear Regression in sklearn.linear_model.
from sklearn.linear_model import LinearRegression
model=LinearRegression()
model.fit(X_train,y_train)
print(model)
This code would output the configuration of our Linear Regression model.

Let’s predict our test data using our train model and then calculate the metrics of our trained regression model. To evaluate a Regression model we have some metrics as listed below :
- RMSE ( Root Mean Squared Error ).
- MAE ( Mean Absolute Error ).
- R-Squared error.
Root Mean Squared Error :
It represents the sample standard deviation of the differences between predicted values and observed values (called residuals). Mathematically, it is calculated using this formula:

Mean Absolute Error :
MAE is the average of the absolute difference between the predicted values and observed value. It is calculated using the formula :

R-Squared Error:
The numerator is MSE ( average of the squares of the residuals) and the denominator is the variance in Y values. Higher the MSE, smaller the R-squared and poorer is the model.

Fortunately, we need not implement all these manually. sklearn provides us all these in its metrics module.
from sklearn.metrics import mean_squared_error, r2_score
print("Mean Squared Error: %.2f"% mean_squared_error(y_test,predicted))
print("R-Squared Error: %.2f"% r2_score(y_test,predicted))
The output of the code is as follows:

By looking at the metrics, we can say our model can still be improved and reduce the error. I would love to make you guys do that by performing feature selection and some engineering and mail me at tarunnanduri7@gmail.com. Your error might vary even though you implement the same model beacuse the split can be different in case of yours due to randomized splitting by train_test_split.
In this article, we looked at Linear Regression and its types. We also had a look on over fitting and underfitting followed by implementation of Linear Regression in python on Boston House Pricing dataset which is Multiple Linear Regression. You can clone or download the notebook in my github repo.In our next article, we will continue our learning on different Machine Learning models. Until then, cheers✌✌.

2 responses to “Machine Learning: Regression”
[…] Regression can be simply understood as an extension to Linear Regression.Generally, in linear regression we deduce a linear relationship between the predictives and the […]
LikeLike
Appreciating the hard work you put into your site and in depth information you offer. It’s good to come across a blog every once in a while that isn’t the same outdated rehashed material. Fantastic read! I’ve bookmarked your site and I’m including your RSS feeds to my Google account.
LikeLike